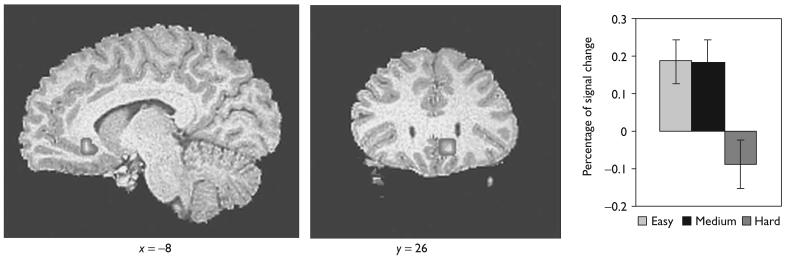
Fig. 1.
Sagittal (x = − 8) and coronal (y = 26) slices showing increased activity for the subgenual anterior cingulate cortex as the inhibitory level of difficulty decreased in the ROI analysis. The bar graphs on the right show the percentage of signal change for the easy, medium, and hard inhibit conditions. Error bars indicate standard error.

