
Figure 5.
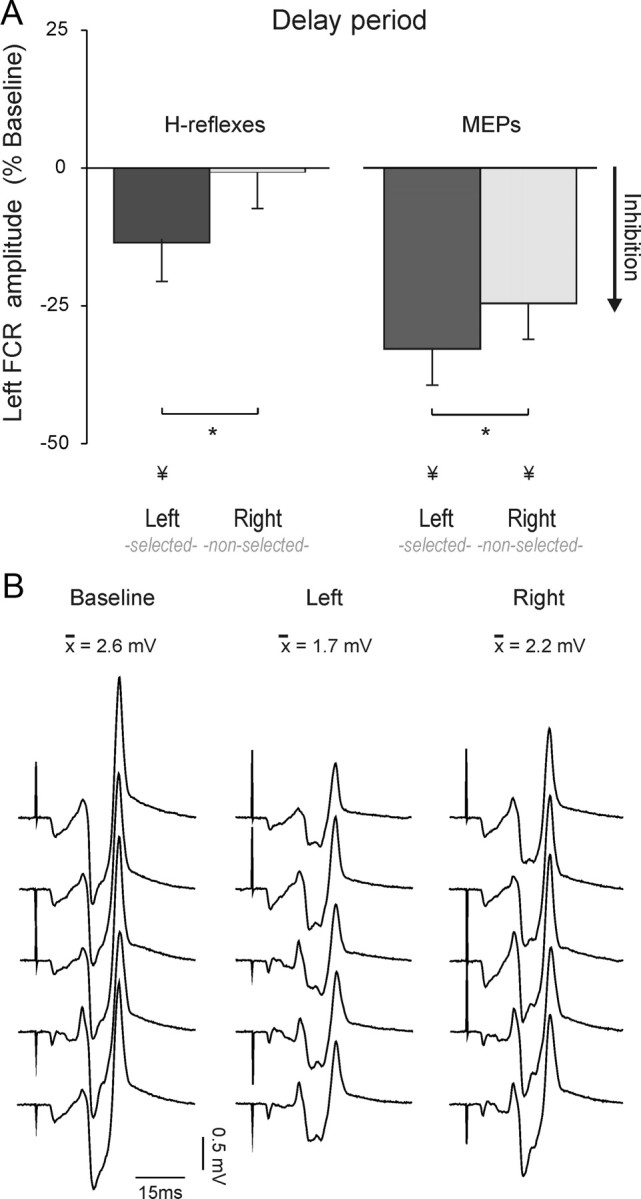
A, Percentage change in H-reflex (left histograms, n = 11) or MEP (right histograms, n = 11) amplitude recorded from the left FCR (flexor carpi radialis) at the end of the delay period. Data are expressed as a function of baseline values. *p < 0.05. ¥Significant difference with respect to baseline. B, Individual H-reflexes recorded from the left FCR in experiment 3 from a representative subject during the baseline epoch or delay period following a left or right hand cue.