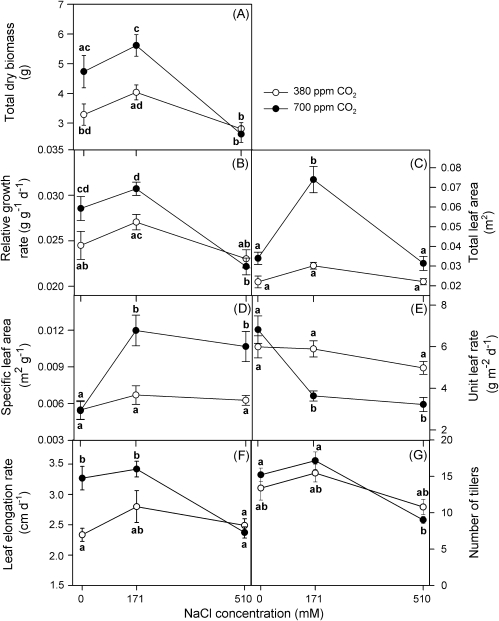
Fig. 2.
Growth analysis of Spartina densiflora in response to treatment with a range of salinity concentrations at ambient and elevated CO2 concentration over 90 d. Total dry mass (A), relative growth rate (B), total leaf area (C), specific leaf area (D), unit leaf rate (E), leaf elongation rate (F), and number of tillers (G). Values represent mean ±SE, n=7 (n=14 for total leaf area). The analysis was carried out on an ash-free dry mass basis. Different letters indicate means that are significantly different from each other (two-way ANOVA, CO2×salinity; Tukey test, P <0.05).

