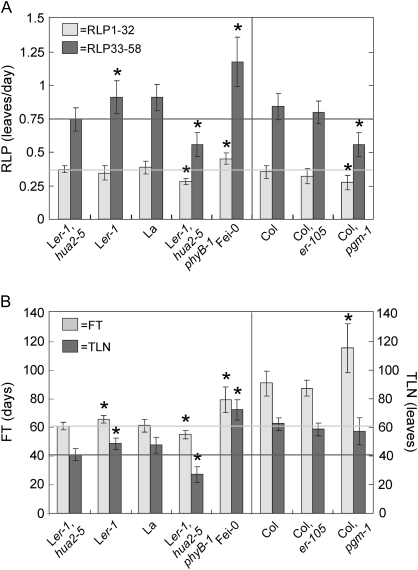
Fig. 5.
Rates of leaf production, flowering time, and leaf number of mutant lines. (A) Average rate of leaf production from day 1 to 32 (RLP1-32) and from days 33 to 58 (RLP33-58). (B) Flowering time (FT) and total leaf number (TLN) of the same genotypes. Each panel shows the mean ±SD of 10–15 plants grown under SD photoperiod of the following genotypes: Landsberg parental line of the Ler×Fei-0 RILs carrying the er-1 and hua2-5 mutant alleles (Ler-1, hua2-5); Landsberg line carrying wild-type alleles of HUA2 (Ler-1); Landsberg accession with wild-type ERECTA and HUA2 alleles (La); phyB-1 mutation in Ler-1, hua2-5 genetic background (Ler-1, hua2-5, phyB-1); Fei-0 parental accession; Col accession; er-105 and the pgm-1 mutants in a Col genetic background. Statistical comparisons were carried out between the following pairs of genotypes in the Ler background: Ler-1 and Ler-1, hua2-5; La and Ler-1; Ler-1, hua2-5, phyB-1 and Ler-1, hua2-5; Fei-0 and Ler-1, hua2-5. Col background mutants were compared to Col accession. Significant phenotypic differences are indicated with asterisk on the first genotype of those pair comparisons (P <0.01). Horizontal lines mark the phenotypic levels of the Ler-1, hua2-5 parental line.

