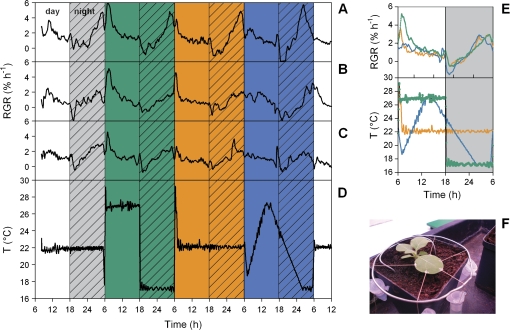
Fig. 2.
Relative growth rates (RGR) of leaves of N. tabacum grown in different temperature regimes. (A, B, C) The RGR of three replicate plants, respectively. The temperature regime to which these plants were exposed is depicted in (D). Average values are shown in (E) with colours coding for the three different temperature regimes to which the plants were subsequently exposed. Positioning of the leaf for growth analysis is shown in (F).

