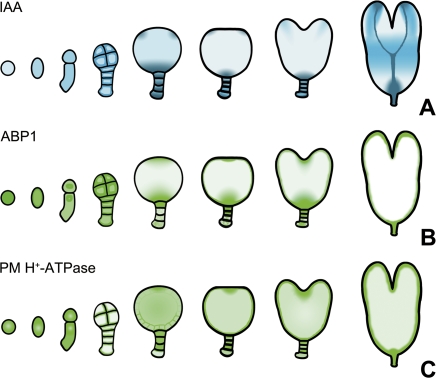
Fig. 10.
A schematic diagram showed the gradual changes of IAA, ABP1, and PM H+-ATPase levels during tobacco zygote and embryo development. The colour marks the expression of DR5::GUS in blue (A), and ABP1 (B) and PM H+-ATPase (C) in green. The degree of colour represents the signal strength. (This figure is available in colour at JXB online.)

