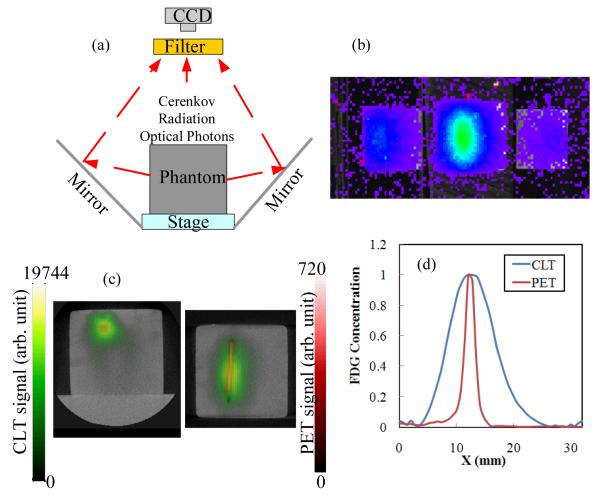
Fig. 1.
(a) Experimental setup for phantom measurements; (b) Cerenkov luminescence measurement from phantom; (c) reconstructed CLT images of FDG concentration (green) fused with PET images (red) and CT images (grayscale) in transverse and coronal sections. (d) Horizontal profile across the target from the transverse section. Peak values are normalized to 1.

