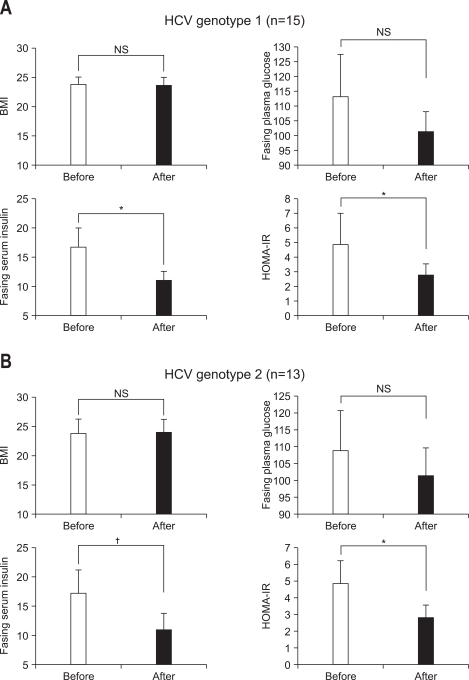
Fig. 2.
BMI, fasting plasma glucose, fasting serum insulin, and HOMA-IR before and after antiviral treatment in sustained responders (A, n=22) and nonresponders (B, n=6). Data were obtained before and at 6 months after the end of antiviral treatment. Bar and vertical line is mean and SD value, respectively.
*p<0.05, †p<0.01.
BMI, body mass index; NS, not significant.

