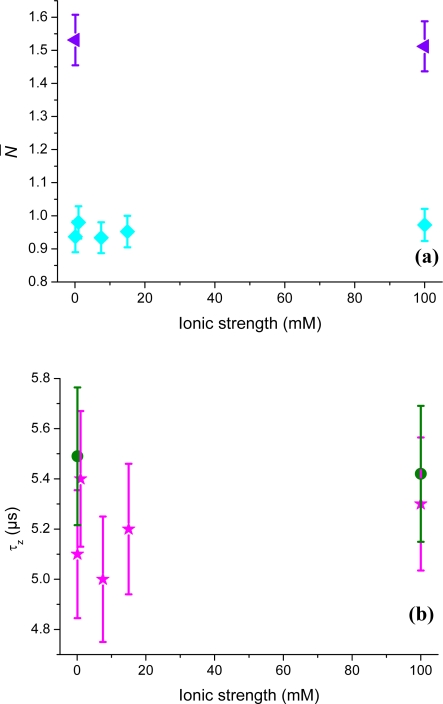
Figure 10.
(a) The number of rhodamine 110 (purple triangles) and ATTO 488 (cyan squares) molecules, N̄, in the TIR-FCS probe volume, as a function of ionic strength. The sample concentration of rhodamine 110 and ATTO 488 were 50 nM and 40 nM, respectively. (b) The axial passage-time, τz, of rhodamine 110 (green hexagons) and ATTO 488 (pink stars).

