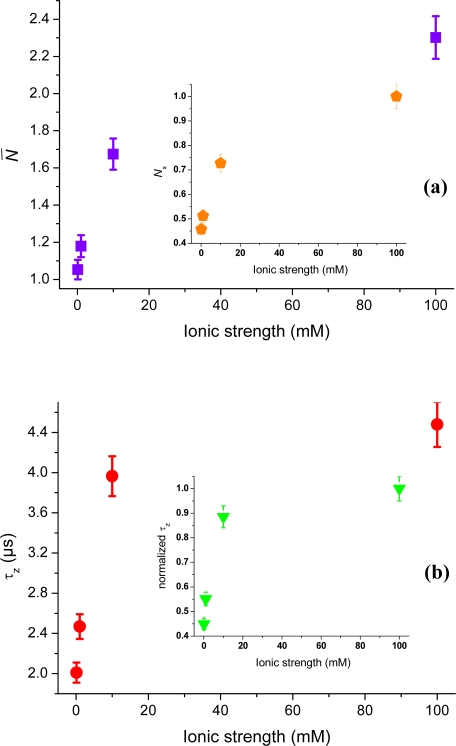
Figure 9.
(a) The number of fluorescein molecules, N̄ (purple squares) in the TIR-FCS probe volume, as a function of ionic strength. The concentration variation ratio of molecules, Nx, is shown in the inset (orange pentagons). The sample concentration was 100 nM. (b) The axial passage-time, τz, for fluorescein as function of ionic strength (red circles). The inset shows the normalized axial passage-time (triangles).

