Table 1.
Mutagenic activity expressed as the mean and standard deviation of the number of revertants/plate in bacterial strains TA100 and TA102 exposed to compounds (1–6) and HU, at various doses, with (+S9) or without (−S9) metabolic activation.
| Revertants/plate in Salmonella typhimurium strains | |||||
|---|---|---|---|---|---|
| Compounds | Concentration μmol/plate | TA100 | TA102 | ||
| +S9 | −S9 | +S9 | −S9 | ||
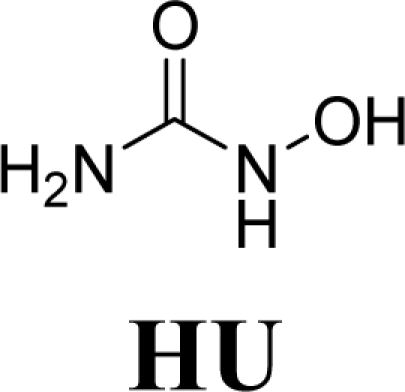 |
0 | 129.3 ± 8.1 | 143 ± 4.8 | 372.3 ± 20.5 | 370 ±17.2 |
| 29.25 | 178.33 ± 15.1* (1.4) | 149 ± 8.9 (1.0) | 399 ± 31 (1.1) | 411.3 ± 9.8 (1.1) | |
| 58.5 | 240 ± 3** (1.8) | 159 ± 11 (1.1) | 484.6 ± 36 (1.3) | 498 ± 15.3 (1.3) | |
| 117 | 220.7 ± 17.8** (1.7) | 268.7 ± 13.5* (1.9) | 563.3 ± 22** (1.5) | 602 ± 8.7* (1.6) | |
| 234 | 276 ± 27.7** (2.1) | 345 ± 21.2** (2.4) | 764.3 ± 20** (2.0) | 799.6 ± 12** (2.2) | |
| 468 | 315.3 ± 16.1** (2.4) | 358.6 ± 5.5** (2.5) | 593 ± 23** (1.6) | 550 ± 7.5** (1.5) | |
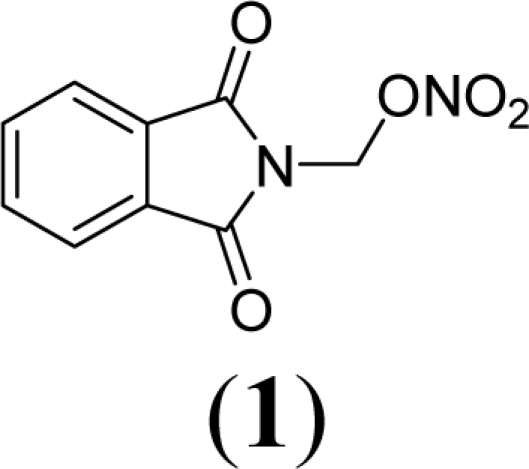 |
0 | 129.3 ± 8.1 | 136.7 ± 2.4 | 213.5 ± 15.5 | 197.33 ± 16.01 |
| 0.007 | 126.3 ± 8.1 (1.0) | 140.5 ± 17 (1.0) | 288 ± 11.3 (1.3) | 249.7 ± 12 (1.2) | |
| 0.014 | 133.3 ± 11 (1.0) | 161.7 ± 11 (1.2) | 320.8 ± 17* (1.5) | 263.7 ± 15 (1.3) | |
| 0.028 | 140.3 ± 2 (1.1) | 192.7 ± 3.06 (1.4) | 385 ± 21.8** (1.8) | 261.3 ± 20 (1.3) | |
| 0.056 | 154 ± 14.2 (1.2) | 234 ± 39.5** (1.7) | 499 ± 8.9** (2.3) | 153 ± 21 (0.8) | |
| 0.112 | 155 ± 5.9 (1.2) | 335 ± 15.7**(2.4) | 351.2 ± 12*(1.6) | 141 ± 18 (0.7) | |
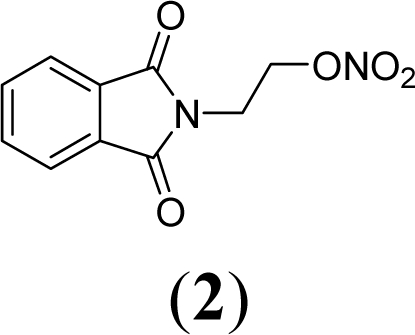 |
0 | 104 ± 7.4 | 115 ± 13.2 | 219 ± 8.9 | 323 ± 10.2 |
| 0.01 | 335 ± 10.8**(3.2) | 171 ± 38.9* (1.5) | 249 ± 11.7 (1.1) | 394 ± 30 (1.2) | |
| 0.021 | 354 ± 6.9**(3.4) | 200 ± 13.3* (1.7) | 269 ± 10.6 (1.2) | 411 ± 24 (1.3) | |
| 0.042 | 397 ± 25.9** (3.8) | 223 ± 15.04* (1.9) | 239 ± 22.5 (1.1) | 452 ± 35.4 (1.4) | |
| 0.085 | 416 ± 15.2** (4.0) | 226 ± 20.2* (2.0) | 247 ± 21.4 (1.1) | 468 ± 23 (1.4) | |
| 0.170 | 261 ± 11** (2.5) | 165 ± 11.1* (1.4) | 205 ± 32 (0.9) | 518 ± 14** (1.6) | |
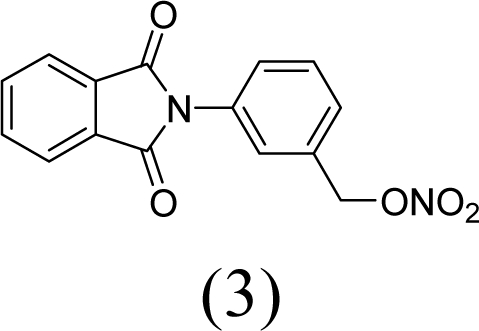 |
0 | 129 ± 8.1 | 179 ± 8.72 | 222 ± 12.5 | 254.7 ± 14.6 |
| 0.224 | 146 ± 5 (1.1) | 216.7 ± 10.2 (1.2) | 272 ± 26 (1.2) | 281 ± 25 (1.1) | |
| 0.488 | 153 ± 13.1 (1.2) | 234.5 ± 24.6 (1.3) | 378 ± 6.1* (1.7) | 286 ± 4.2 (1.1) | |
| 0.896 | 163 ± 9.3(1.2) | 266.3 ± 8.4* (1.5) | 399.3 ± 12* (1.8) | 303 ± 9.2 (1.2) | |
| 1.8 | 165 ± 12.5 (1.3) | 294.5 ± 5.3* (1.6) | 405 ± 11* (1.8) | 395.7 ± 9** (1.5) | |
| 3.58 | 155 ± 8.2 (1.3) | 323.7 ± 10.2* (1.8) | 431 ±17.9* (1.9) | 410.3 ± 9.7* (1.6) | |
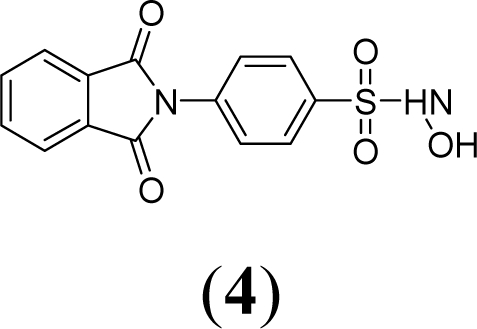 |
0 | 129.3 ± 8.14 | 126.7 ± 12.1 | 312.3 ± 27.5 | 197.3 ± 16.1 |
| 0.98 | 160 ± 12.4 (1.2) | 146.3 ± 5.1 (1.1) | 323 ± 5.54 (1.0) | 222 ± 12 (1.1) | |
| 1.96 | 175.7 ± 2 (1.4) | 172.7 ± 7.8 (1.4) | 385 ± 33.1 (1.2) | 241 ± 13 (1.2) | |
| 3.92 | 194.2 ± 15 (1.5) | 190 ± 11.3* (1.5) | 423.7 ± 22 (1.3) | 251 ± 19.2(1.3) | |
| 7.85 | 206 ± 13.6** (1.6) | 208 ± 12.5* (1.6) | 443 ± 14.4 (1.4) | 232 ± 13.1(1.2) | |
| 15.7 | 354 ± 6.5* (2.7) | 155 ± 2.8 (1.22) | 295 ± 4.9 (0.9) | 210 ± 17 (1.1) | |
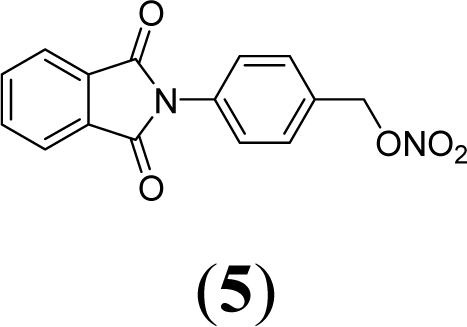 |
0 | 129.3 ± 8.1 | 179 ± 8.7 | 372.3 ± 27.5 | 260.1 ± 11.6 |
| 0.224 | 157 ± 13 (1.2) | 220 ± 18 (1.2) | 385.7 ± 13 (1.0) | 340.3 ± 9.7 (1.3) | |
| 0.488 | 184.7 ± 16* (1.4) | 239 ± 11.5 (1.3) | 427.3 ± 5 (1.1) | 373.5 ± 21 (1.4) | |
| 0.896 | 192.7 ± 16* (1.5) | 261 ± 10.2 (1.4) | 436.7 ± 21 (1.2) | 391.2 ± 6.3* (1.5) | |
| 1.8 | 216.7 ± 18** (1.7) | 303,8 ± 17* (1.7) | 390.3 ± 9.3(1.0) | 486.8 ± 20** (1.9) | |
| 3.58 | 263 ± 12.3** (2.0) | 349 ± 5.6** (1.9) | 350 ± 6 (0.9) | 420 ± 8.6* (1.6) | |
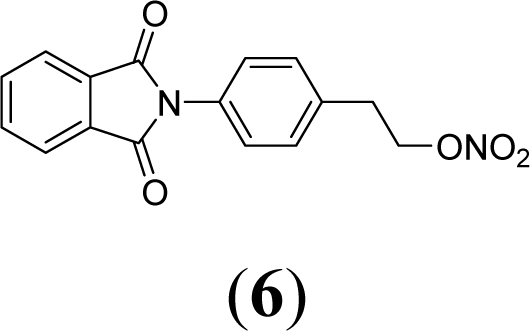 |
0 | 129.3 ± 8.1 | 116.7 ± 12.4 | 295.3 ± 28 | 197.3 ± 16.1 |
| 0.12 | 363 ± 25.2** (2.8) | 121.5 ± 14 (1.0) | 335.3 ± 11 (1.1) | 245 ± 6.9 (1.2) | |
| 0.25 | 478.7 ± 4.22 **(3.7) | 135.3 ± 12 (1.1) | 372.3 ± 27.5 (1.3) | 262 ± 19.1 (1.3) | |
| 0.5 | 628 ± 40.8** (4.9) | 138.3 ± 13 (1.2) | 406 ± 14.1 (1.4) | 286.7 ± 18 (1.4) | |
| 1 | 739 ± 25.4** (5.7) | 153.3 ± 5 (1.3) | 465 ± 10.6* (1.6) | 305.7 ± 10* (1.5) | |
| 2 | 750 ± 13.6** (5.8) | 177 ± 23.6* (1.5) | 447 ± 19.8* (1.5) | 201 ± 4.7 (1.0) | |
| Positive control*** | - | 2545 ± 73.6 | 2231 ± 66.9 | 812 ± 26.1 | 881 ± 56.1 |
0 = negative control (DMSO–100 μL/plate)
P < 0.01 or
P < 0.05 (ANOVA). The values in parenthesis = mutagenic index. Numbers represent averages of triplicates from the three different experiments ± the standard deviation.
Positive control: sodium azide (1.25 μg/plate) for TA100 (−S9), daunomycin (3 μg/plate) for TA102 (−S9) and 2-anthramine (1.25 μg/plate) for TA100 (+S9) and 2-aminofluorene (1.25μg/plate) for TA102 (+S9).
