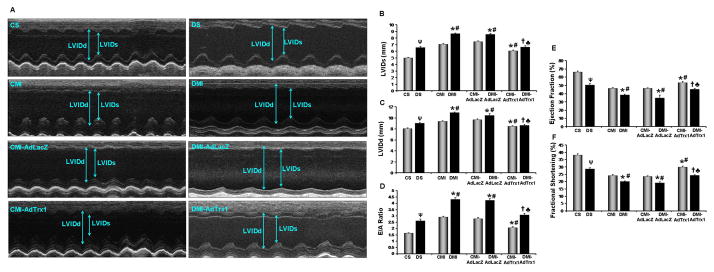
Figure 7.
Effect of Trx1 gene therapy on left ventricular myocardial functions (echocardiography). (A) Representative echocardiograph pictures of parasternal short axis images, 30 days after MI and gene therapy. Bar graphs represent: - (B) Left Ventricular Inner Diameter in systole (LVIDs, in mm); (C) Left Ventricular Inner Diameter in diastole (LVIDd, in mm); (D) E/A ratio; (E) Ejection Fraction (EF in %) and (F) Fractional Shortening (FS in %). There was significant diastolic (as evidenced by increased E/A ratio) and systolic (as evidenced by reduced EF and FS) functional disorder in the DMI and DMI-AdLacZ groups compared to the CMI and CMI-AdLacZ groups, respectively. There was no significant difference in the myocardial functions in the Ad.LacZ treated group compared to the respective non-treated MI groups. Trx1 gene therapy significantly improved both diastsolic and systolic functional parameters when compared to non-treated and Ad.LacZ treated MI groups, in both non-diabetic and diabetic myocardium. Values are mean ± SEM. (n = 4–5/group). CS represents control Sham, CMI represent control group with MI, CMI-AdLacZ represents CMI rats injected with Ad.LacZ, CMI-AdTrx1 represents CMI rats injected with Ad.Trx1, DS represents diabetic Sham, DMI represent diabetic group with MI, DMI-AdLacZ represent DMI rats injected with Ad.LacZ and DMI-AdTrx1 represent DMI rats injected with Ad.Trx1. ψp ≤ 0.05 when DS compared to CS, *p ≤ 0.05 when compared with CMI, #p ≤ 0.05 when compared with CMI-AdLacZ, †p ≤ 0.05 when compared with DMI and ♣p ≤ 0.05 when compared with DMI-AdLacZ.

