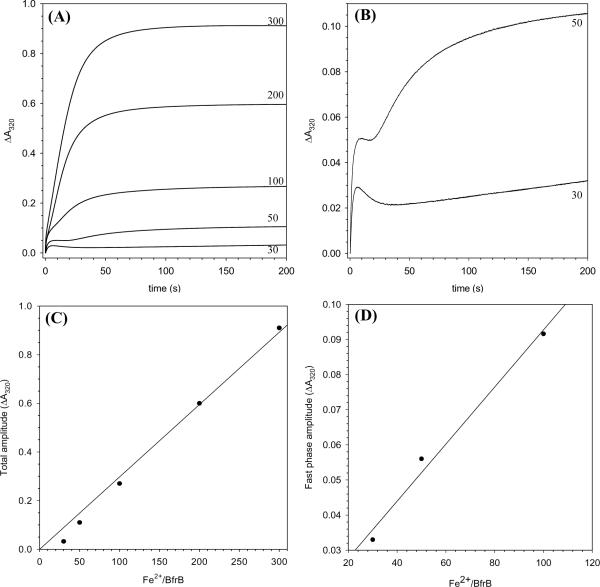
Figure 12.
(A) Progress curves obtained with the aid of a stopped flow apparatus after the addition of 30, 50, 100, 200 and 300 Fe2+ ions per Pa BfrB molecule in 100 mM MES buffer, 100 mM KCl, pH 6.5 and 30 °C. Protein concentration is 1.0 μM (after mixing) and the path length is 1.0 cm. (B) Progress curves corresponding to the addition of 50 and 100 Fe2+ ions in (A) are shown to more clearly illustrate the decrease in absorbance that follows the fast phase. (C) A plot of the amplitude obtained at the end of 200 s for the progress curves in (A). (D) A plot of the amplitude of the fast phase as a function of Fe2+ load; the amplitudes were obtained from fitting the first 5 s of the progress curves in (A), obtained after the addition of 30, 50 and 100 Fe2+ ions, to a mono exponential expression.

