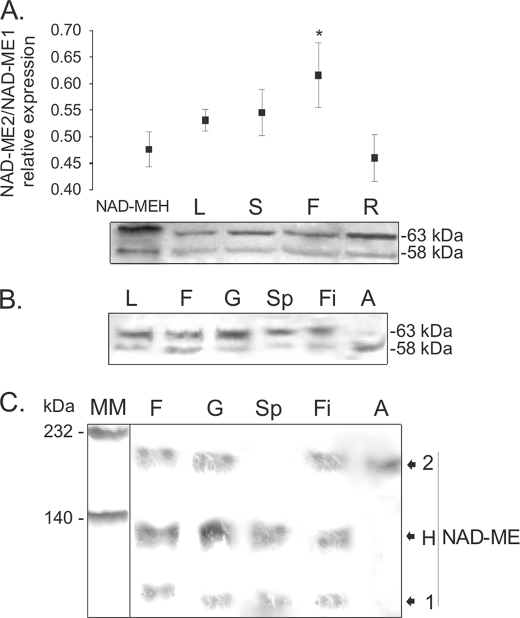
FIGURE 5.
SDS- and native-PAGE of extracts of Arabidopsis organs analyzed by Western blot. A, shown is a Western blot of crude extracts of different Arabidopsis organs after SDS-PAGE. To assess the relative NAD-ME1 and -2 immunoreactivity toward the antibodies, 50 ng of NAD-MEH, which has a 1:1 protein:protein relationship between NAD-ME1 and -2, was loaded in the first lane (NAD-MEH). Fifty μg of total soluble protein from leaf (L), stem (S), flower (F), and root (R) were loaded. Molecular masses of the immunoreactive bands are shown on the right (kDa). The assay was performed using a mixture of specific antibodies against NAD-ME1 and -2. The relative quantification of the immunoreactive bands of NAD-ME1 and -2 for each line is shown in the upper graph. Standard deviations of the densitometric analysis among at least three different Western blots are shown, and the asterisk indicates a significant different relative level of expression (p < 0.05). B, shown is a Western blot of the separated components of Arabidopsis flowers after SDS-PAGE. Fifty μg of total soluble protein from leaf (L), flower (F), gynoecium (G), sepal (Sp), filament (Fi), and anther (A) were loaded. Molecular masses of the immunoreactive bands are shown on the right (kDa). The assay was performed using a mixture of specific antibodies against NAD-ME1 and -2. C, shown is a Western blot of the separated components of Arabidopsis flowers after Native-PAGE. Fifty μg of total soluble protein from flower (F), gynoecium (G), sepal (Sp), filament (Fi), and anther (A) were loaded. The assay was performed using a mixture of specific antibodies against NAD-ME1 and -2. Molecular mass markers (MM) were run in parallel and stained with Coomassie Blue. The mobility of purified NAD-ME1, -2, and -H in native gels (Fig. 1C) is indicated on the right.

