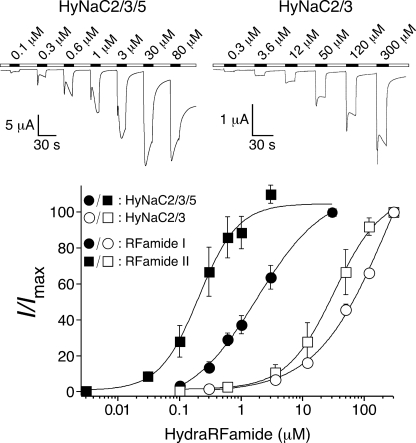
FIGURE 5.
HyNaC5 strongly increases apparent affinity for Hydra-RFamides. Top, representative current traces of whole oocytes either expressing HyNaC2 and -3 or HyNaC2, -3, and -5; channels were activated with Hydra-RFamide I. Bottom, concentration-response curves for HyNaC2/3 (open symbols) and HyNaC2/3/5 (closed symbols), each with Hydra-RFamides I (circles) and II (squares). Error bars represent S.E., and lines were fitted to the Hill function. Current amplitudes were normalized to the amplitude obtained with the highest concentration of the ligand (Imax) (n = 8 for HyNaC2/3/5 and n = 4 for HyNaC 2/3).

