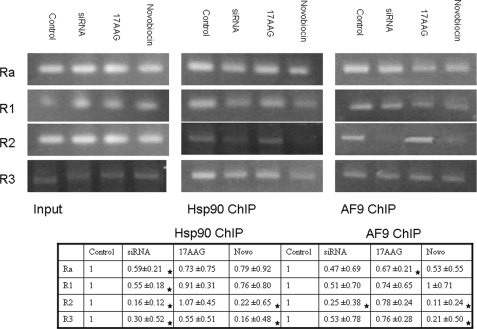
FIGURE 7.
Analysis of the ENaCα promoter region by ChIP. ChIP was performed with Hsp90 and AF9 antibodies and precipitated DNA was amplified by primers spanning the region −1372 to +494 relative to the start site. The primers are described in the text and are derived from the work of Zhang et al. (6) and personal communication with Dr. Zhang. The experiment was repeated in triplicate and fold difference relative to control was calculated using densitometry from the NIH program Image J. The combined data are presented as 95% confidence intervals (CI) of a t distribution of unknown variance. CIs that fall outside the control value of 1.0 are indicated with a star.

