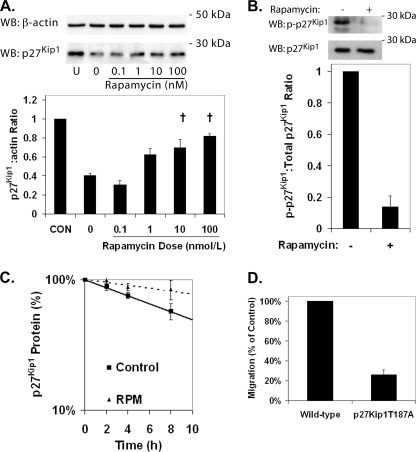
FIGURE 2.
Rapamycin treatment increases the level of p27Kip1 protein in HCAECs through inhibition of its degradation. HCAECs were starved for 72 h and then serum-stimulated in the presence of rapamycin for 24 h. A, representative Western blots (WB) and densitometric analysis for p27Kip1 and β-actin in HCAECs treated with increasing doses of rapamycin. Error bars represent the mean ± S.E. (n = 3) of the ratio of p27Kip1 to β-actin normalized to the unstimulated control (CON). †, p < 0.05 compared with samples treated with vehicle alone (0). B, representative Western blot and densitometric analysis demonstrating the inhibition of phosphorylation of p27Kip1 at Thr187 in HCAECs treated with rapamycin (100 nmol/liter) and MG-132. Error bars represent mean ± S.E. (n = 3) relative to controls. †, p < 0.01. C, comparison of p27Kip1 protein half-life in HCAECs pretreated with either vehicle or 100 nmol/liter rapamycin (RPM) for 24 h. Data points represent mean ± S.E. (n = 3). D, shown is migration of wild-type and p27Kip1T187A ECs toward VEGF (10 ng/ml). Error bars represent mean ± S.E. (n = 3).

