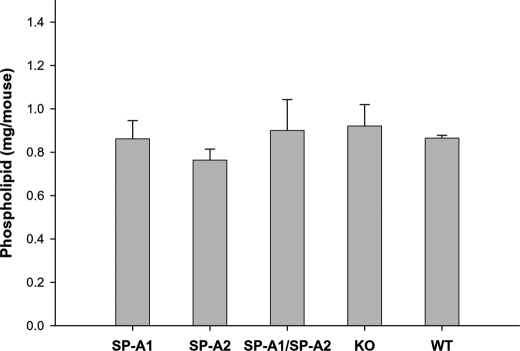
FIGURE 5.
Comparison of total phospholipids in the BAL fluid of hTG, KO, and WT mice. hTG mice (SP-A1(6A4), SP-A2(1A3), and SP-A1/SP-A2(6A4/1A3)), KO mice, and WT mice were killed, and the lung was lavaged three times, each time with 0.5 ml of saline buffer. The BAL was centrifuged at 150 × g to remove cells, and the supernatant was used for analysis. Each group contains five mice. The content of total phospholipids in the BAL fluid from each mouse was then determined by an in vitro phospholipids assay kit (Wako Diagnostics, Richmond, VA). The data were analyzed by a one-way analysis of variance test (significant differences were considered when p was <0.05). The results indicated no significant differences in the levels of total phospholipids of each group among hTG, KO, and WT mice.

