FIGURE 5.
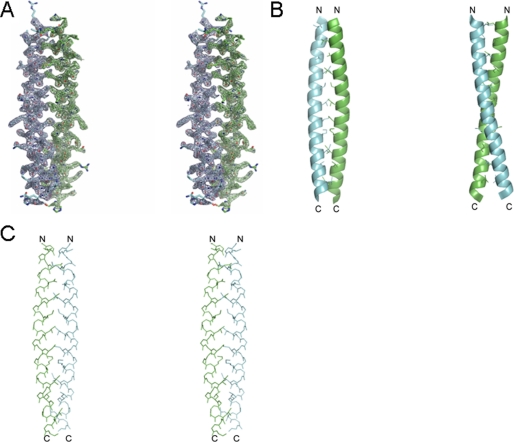
Crystal structure of the C terminus. A, a stereoview of the 2.0 Å resolution 2|Fo| − |Fc| electron density map (contoured at 1.5σ) from residues 226–266 of Hv1. B, the backbone as a ribbon with side chains of interfacial residues added. C, a stereoview of the backbone and interfacial residues. C and N termini are indicated with the letters C and N, respectively.

