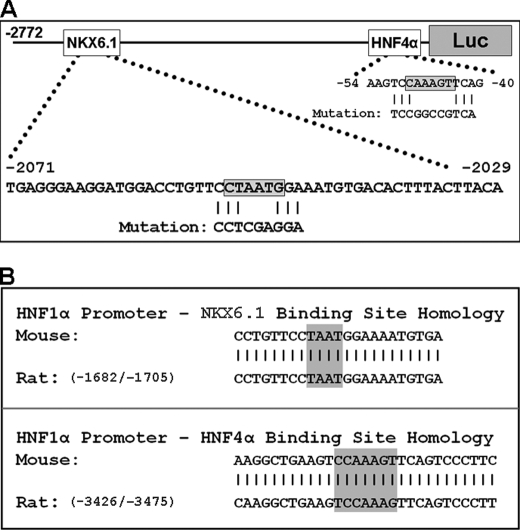
FIGURE 3.
HNF1α promoter analysis. A, HNF1α promoter mutations. The locations of the NKX6.1- and HNF4α-binding sites are indicated in boxes on the promoter. Sequences below the shaded boxes show the induced mutations. B, HNF1α promoter species alignment. Mouse and rat (GenBankTM accession number X67649) HNF1α promoter sequences surrounding the NKX6.1-binding (upper panel) and HNF4α-binding (lower panel) sites are shown. Vertical lines indicate the close homology between species. The shaded boxes indicate core-binding sequences.

