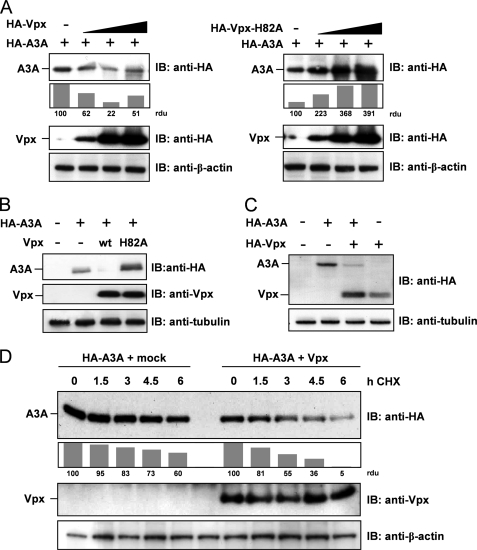
FIGURE 3.
Vpx, but not H82A-Vpx, supports degradation of APOBEC3A. A: left, 293T cells were transfected with constant amounts of HA-tagged A3A and increasing amounts of HA-Vpx-encoding plasmid. Proteins were detected by immunoblot (IB) analysis with antibodies against HA tag and β-actin as loading control. Protein band intensity was quantified with densitometry, defining A3A protein levels in the absence of Vpx as 100 relative density units (rdu). Right, 293T cells were transfected and analyzed as the left panel using the H82A-Vpx mutant. B, 293T cells were transfected with HA-A3A and Vpx or H82A-Vpx in a A3A:Vpx DNA ratio of 1:6. Cell lysates were analyzed by immunoblotting using anti-HA and anti-Vpx antibodies. C, U937 monocytic cells were transfected with HA-A3A and HA-Vpx in a DNA ratio of 1:1. Cell lysates were immunoblotted and analyzed with an anti-HA antibody. D, 293T cells were transfected with plasmids encoding HA-A3A and Vpx or empty vector in a DNA ratio of 1:5. 42 h after transfection and 6 h before harvest, cells were treated with 100 μg/ml cycloheximide (CHX) for the indicated period. Western blot analysis was performed as described in B, and protein bands were quantified defining A3A protein levels of cycloheximide-untreated cells as 100 relative density units.

