FIGURE 5.
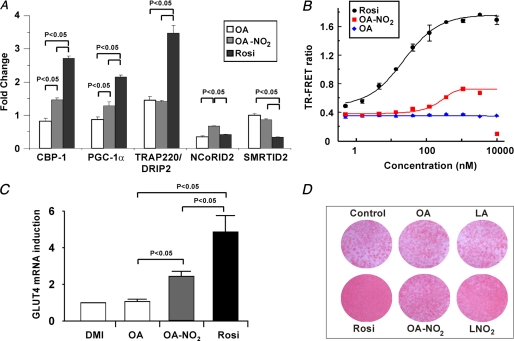
OA-NO2 is a partial agonist of PPARγ. A, fold-change in TR-FRET ratios (ligand/no ligand) was determined for the ligands Rosi (5 μm), OA (20 μm), and OA-NO2 (5 μm) and for indicated coregulator peptides. Ligand concentrations were utilized that induced maximum receptor occupancy as reflected by fluorescent reporter-ligand displacement. Statistics were calculated by a one-way ANOVA (post hoc Tukey). B, PPARγ β-lactamase reporter assays for Rosi, OA, and OA-NO2 with concentrations ranging from 0.5 to 10,000 nm. Curve-fitting equations were determined by XLfit4. C, Glut4 gene expression in 3T3-L1 adipocytes differentiated with DMI ± 3 μm agonist (day 8). Data are expressed as mean ± S.D. and evaluated by a one-way ANOVA, post hoc Tukey test. D, Oil Red-O staining of 3T3-L1 adipocytes differentiated with DMI ± 3 μm agonist (day 7).

