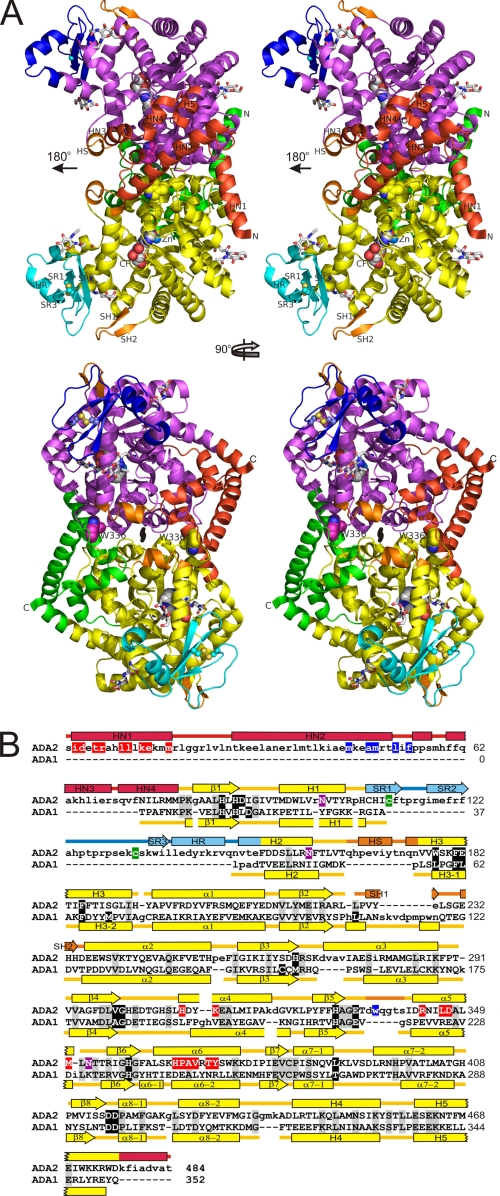
FIGURE 1.
Structure of human ADA2. A, ribbon diagram of the ADA2 dimer (stereo view). “Butterfly” view of the molecule (top) and molecule rotated 90° around vertical axis toward the viewer (below). The ADA, dimerization, and PRB domains are shown in yellow, green, and cyan in one subunit and in magenta, red, and blue in the second subunit, respectively. Small unique elements are painted in orange. Catalytic Zn2+, coformycin molecules bound in the active sites, and Trp-336 are shown as spheres. Asparagine-linked N-acetyl glucosamine as well as the disulfide in PRB domains are shown with sticks. Oxygen, nitrogen, and sulfur atoms are painted in red, blue, and yellow, respectively, whereas carbon atoms are colored in white, green, yellow, or magenta. Secondary structure elements unique for ADA2 segments are labeled. The local two-fold symmetry axis is indicated. B, structural alignment of human ADA2 and mouse ADA1 (PDB accession code 2ADA). Structurally equivalent and nonequivalent residues are shown in upper and lower cases, respectively. Amino acid identities are indicated by background shading in gray. Active site residues are shown on the black background. Residues involved in the helix anchor and tryptophan catch intersubunit contacts are shown on red and blue backgrounds, respectively. The disulfide bond-linked cysteines and glycosylated asparagines are indicated by background shading in green and magenta, respectively. Secondary structure (rectangle, α-helix; arrow, β-strand; line, coil) is shown above and below the amino acid sequence of ADA2 and ADA1, respectively. The ADA domains of ADA2 and ADA1 are painted in yellow; ADA2 dimerization and PRB domains and small unique elements are painted in red, blue, and orange, respectively.

