FIGURE 4.
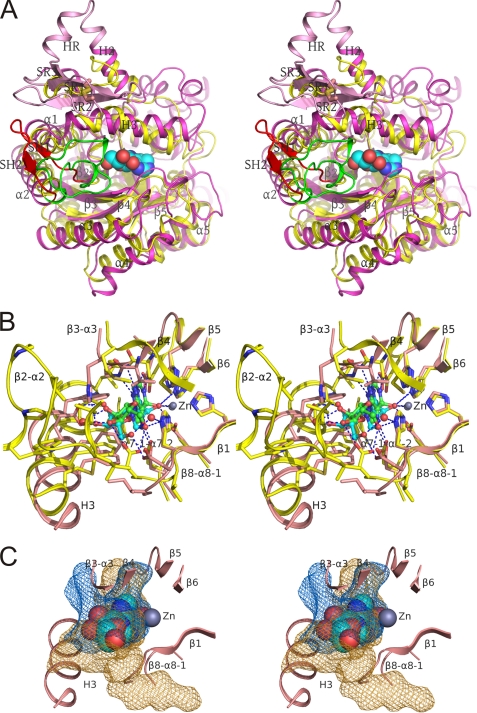
Comparison of the active site in ADA2 and ADA1. A, superposition of structures of human ADA2 and mouse ADA1 (PDB accession code 2ADA) (cartoon diagrams, stereo view). ADA2 is painted in magenta except for the putative receptor-binding domain (pink) and SH1-SH2 hairpin (red). ADA1 is painted in yellow except for loop β2-α2 (green). The Cys-111–Cys-133 disulfide bond is shown with sticks. The coformycin molecule in the ADA2 catalytic site is shown as spheres. B, superposition of active site residues in human ADA2 and mouse ADA1 complexed with coformycin and HDPR, respectively (stereo view). The main chain is shown as a schematic painted in pink and yellow for ADA2 and ADA1, respectively. Side chains of the active site residues are shown with sticks and colored by the type of element. Carbon atoms in ADA2, ADA1, coformycin, and HDPR are shown in pink, yellow, cyan, and green, respectively. Atoms of oxygen and nitrogen are painted in red and blue, respectively, in all structures. Zinc atom and water molecules in contact with ligands are shown as spheres in gray and red, respectively. ADA2 is shown in the same orientation as in Fig. 3. Dashed lines represent hydrogen bonds between ligands and proteins and zinc coordination by ligands. C, the catalytic site of ADA2 is more open than that in ADA1. Cavities in the active sites of ADA2 and ADA1 (which were superimposed and displayed in the same orientation as that in B) are shown with mesh in orange and blue colors, respectively. For clarity only the ribbon diagrams of the ADA2 active site and ADA2 complexed with the coformycin molecule are shown. In A–C, structures were superimposed by distance minimization between Cα atoms of invariant catalytic residues.

