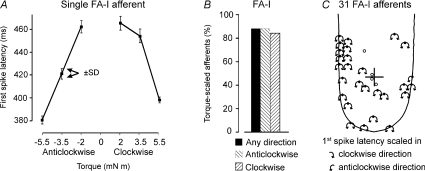
Figure 7. Effect of torque on the latency of the first spike in the response.
Note that for our protocol, torque rate is proportional to torque magnitude because the ramp duration was always 0.5 s. A, each data point represents the mean latency (±s.d., n= 6) for a single FA-I afferent (the same afferent as in Fig. 5. B, the proportion of FA-I afferents with first spike latencies scaled by torque. Hatched bars correspond to afferents scaled by torque in the clockwise or anticlockwise directions and the black bar represents afferents that were scaled by torque in any direction (i.e. clockwise, anticlockwise or both directions). C, arrows originating from the RFC indicate the direction in which the first spike latencies were scaled by torque as assessed by Spearman's rank correlation. The rotational centre of the applied torque (first contact point) is indicated by a cross. RFCs of afferents not scaled by torque are represented by open circles.

