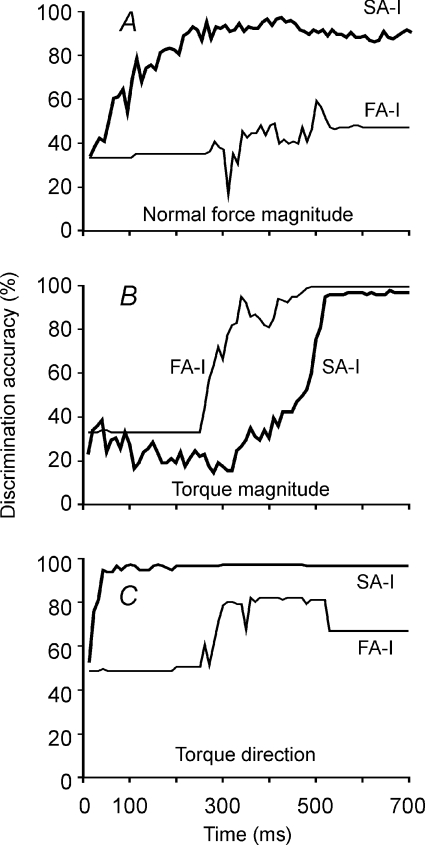
Figure 8. Capacity of the SA-I population (thick lines) and the FA-I population (thin lines) to determine the values of the three stimulus parameters.
A, accuracy of classifying the three normal force magnitudes (1.8, 2.2, 2.5 N) as a function of time after the commencement of torque. B, accuracy of determining the three torque magnitudes (0, 2.0, 3.5 mNm). C, discrimination of two torque directions (clockwise, anticlockwise). There were 58 afferents in the SA-I population and 23 afferents in the FA-I population. Discrimination accuracy was estimated from 108 test stimuli.

