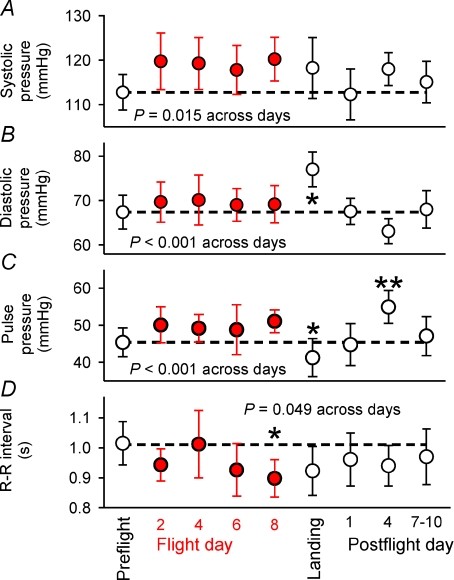
Figure 2. Mean (± 95% confidence limits) baseline arterial pressures and R–R intervals associated with each baroreflex test.
Dashed lines indicate preflight averages. Results from repeated measures analysis of variance are given. The significance of pairwise differences was determined with the Holm–Sidak test. In panel B: *diastolic pressure was significantly higher on landing day than on all other experimental days. In panel C: *pulse pressure was significantly lower on flight day 8 than preflight, and **significantly higher on postflight day 4 than preflight, landing day, and postflight day 1. In panel D: *R–R intervals were significantly lower on flight day 8 than preflight.

