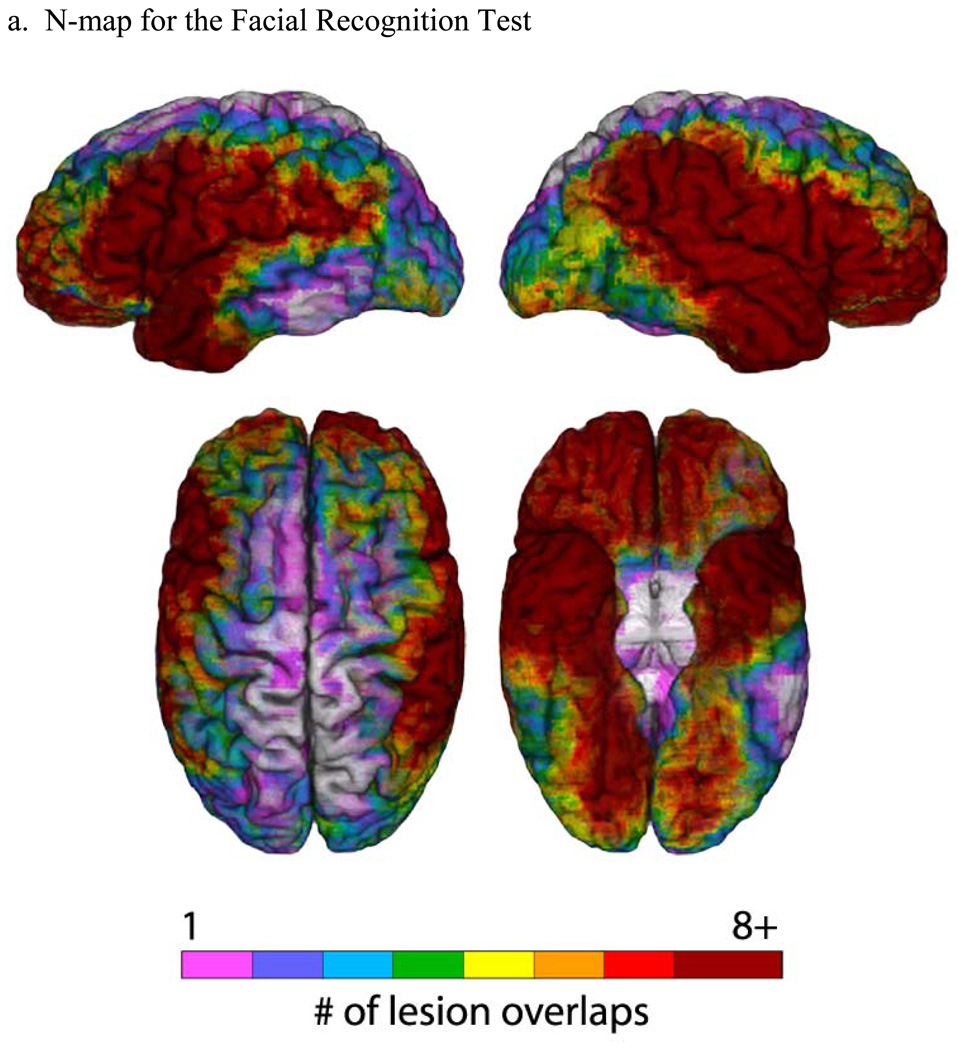
Figure 1. Lesion maps for the Facial Recognition Test.
(a) An N-map, showing the number of lesion overlaps in the entire sample of participants who performed the FRT (overlaid on a reference brain). The colorbar indicates different degrees of lesion overlap, from 1 up to 8, with numbers higher than 8 all coded to dark red. (b) PM3 (lesion proportion difference) map, where the PM3 results are overlaid on a reference brain. Positive values (colorbar) indicate a greater proportion of participants with a lesion and a deficit among those with a deficit, compared to the proportion of participants with a lesion and no deficit among those with no deficit. Negative values (colorbar) indicate a lower proportion of participants with a lesion and a deficit among those with a deficit, compared to the proportion of participants with a lesion and no deficit among those with no deficit. For both (a) and (b), the color-coded outcomes are rendered on left lateral (upper left), right lateral (upper right), superior (bottom left), and inferior (bottom right) hemispheric perspectives.


