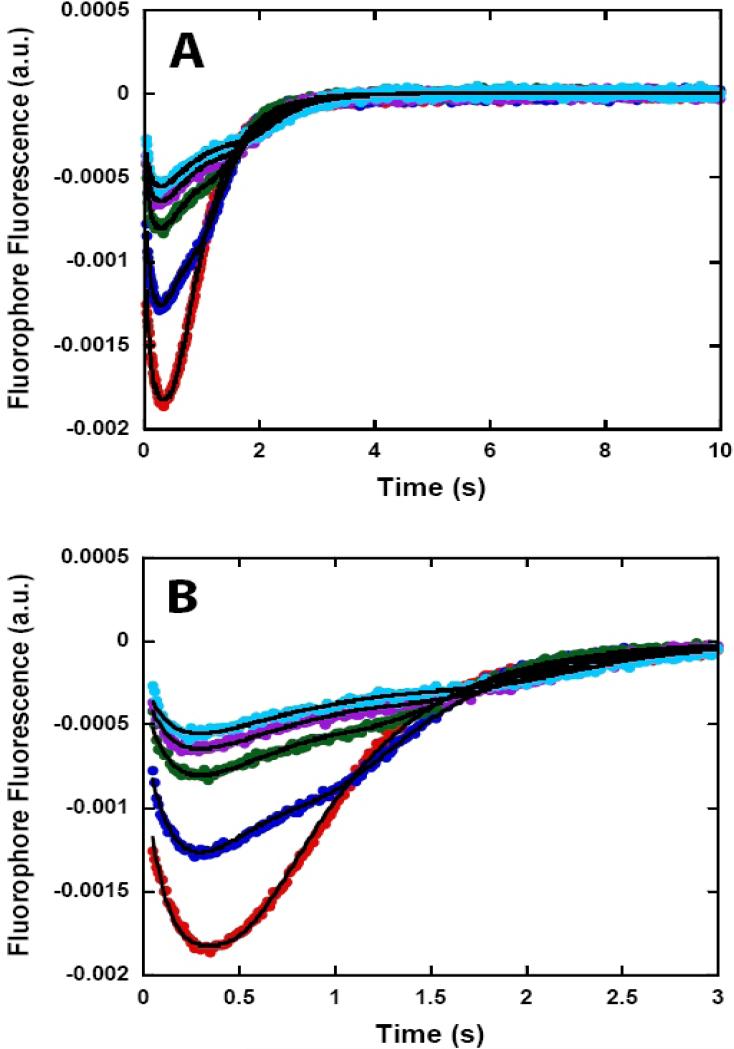
Figure 6.
NS3h translocation kinetics monitored by stopped-flow experiments with fluorescein labeled ssDNA. NS3h (100 nM) was pre-incubated with 200 nM ssDNA labeled at the 5’ end with fluorescein (5’-F-(dT)L at 37 °C in assay buffer and translocation was initiated by the addition of ATP:Mg2+ and heparin to a final concentration of 5 mM, 10 mM, and 4 mg/ml, respectively. Fluorescence time courses at short (A) and long (B) time scales obtained with 5’-F-(dT)40 ( ), 5’-F-(dT)60 (
 ), 5’-F-(dT)72 (
 ), 5’-F-(dT)88 (
 ) and 5’-F-(dT)100 (
 ). The solid lines in the figure are simulations using equation 1 and the best fit parameters obtained from the global NLLS analysis of the time courses using equation 1.

