Figure 2.

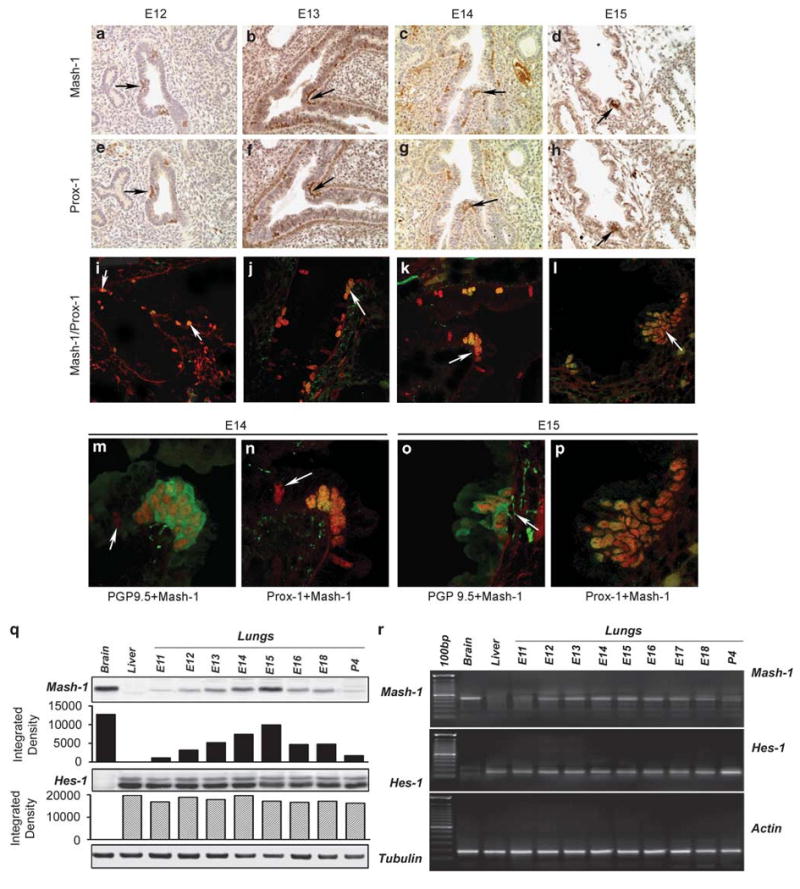
Expression of Mash-1 and Prox-1 in the developing mouse lung. Comparison of immunolocalization of (a–d) Mash-1 and (e–h) Prox-1 on adjacent paraffin sections from E12 to E15 mouse lung. Arrows point to positively stained colocalization of Mash-1 and Prox-1 in PNEC/NEB cells distributed along the airway epithelial basement membrane. The airway in panels a and e shows coexpression in PNEC/NEB, but as more evident in panels b and f, many Mash-1-positive cells did not express Prox-1 (original magnification × 200). (i–l) Confocal microscopy of dual immunofluorescence labeling for Mash-1 (red signal) and Prox-1 (green signal) on frozen sections of mouse lungs between E12 and E14. During early stages of lung development (i–k), only some Mash-1 + cells also coexpressed Prox-1 + (orange signal, arrow, as in panel k). However, by E15, all Mash-1 + cells were also Prox-1 + (l) (original magnification × 480). Higher magnification views of NEB in E14 (m, n) and E15 (o, p) mouse lungs with dual immunoflorescence for PGP9.5/Mash-1 and Mash-1/Prox-1. (m) Dual immunolabeling for Mash-1 in nuclei (red signal) and for neuroendocrine marker PGP9.5 (green signal) in the cytoplasm of NEB cells residing in a larger airway that is better differentiated. (n) Coexpression of Mash-1 and Prox-1 (orange signal) in nuclei of NEB cells located at airway bifurcation. (o) NEB cells showing localization of PGP9.5 (green signal) in the cytoplasm and developing submucosal nerve fibers entering the NEB base, whereas Mash-1 (red signal) is localized in nuclei. (p) A large NEB cell cluster with a uniform coexpression of Mash-1 and Prox-1 (orange signal) in all nuclei. (o) Note fine nerve fibers (arrow) underneath the NEB that label for PGP9.5 (original magnification × 640). (q) Western blot and (r) RT-PCR analyses of gestational series of lungs (E11–E18 and P4). Expression of Mash-1 protein and mRNA peaks at E15 correlating with the immunostaining shown above. No changes were noted in Hes-1 mRNA or protein expression during the same gestation period, except for an apparent increase at P4. Densitometry of western blots confirms a gradual increase in Mash-1 protein expression, peaking at E15 and then decreasing by P4 with minimal variation for Hes-1. All values are relative to positive controls for Mash-1 (brain) and Hes-1 (liver). Loading controls are tubulin for western blots and actin for RT-PCR.
