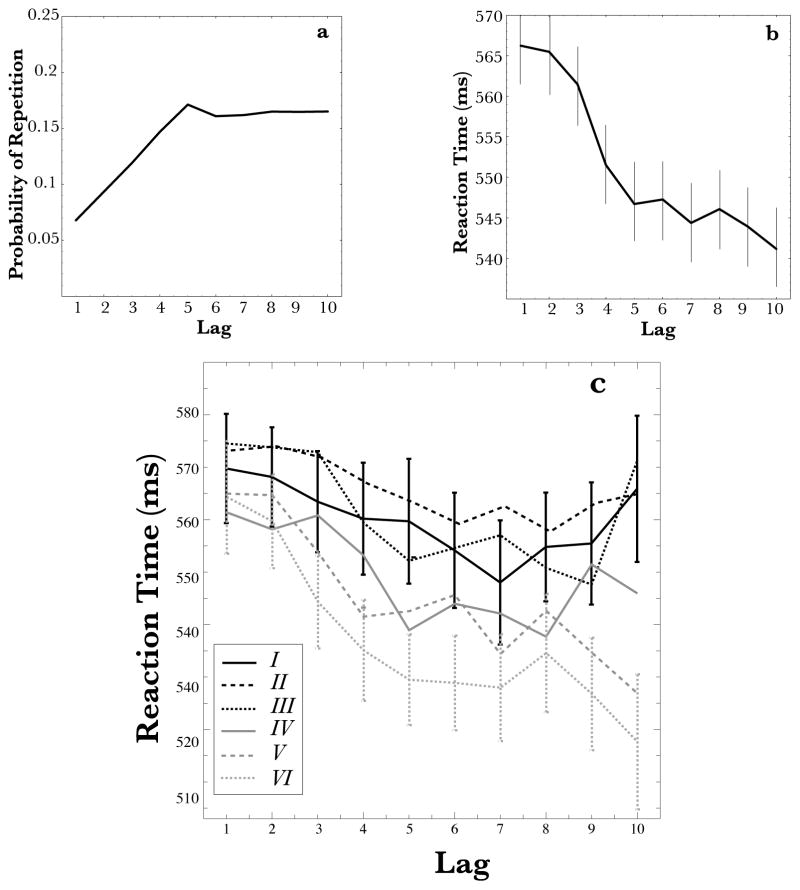
Figure 4.
Panel A: The probability of an event repeating as a function of the number of trials since it was last experienced (lag). Responses become more likely as the number of trials since they were last executed increases. Panel B: RT as a function of the lag between two repeated stimuli in Exp. 1. RT is faster as lag increases, suggesting adaptation to the structure of the task. Panel C: The evolution of the lag effect over the course of the experiment. Each line represents the lag effect for one block of the experiment. In the first block, RT to lag-10 items is very close to the RT for lag-1 items. However, by block VI the speed advantage for lag-10 item has sharply increased. In panel B and C, error bars show standard errors of the mean. In panel C, for visual clarity, error bars are shown only for block 1 and 6, which reflect the beginning and endpoint of learning. However, the nature of variability was similar across all blocks.

