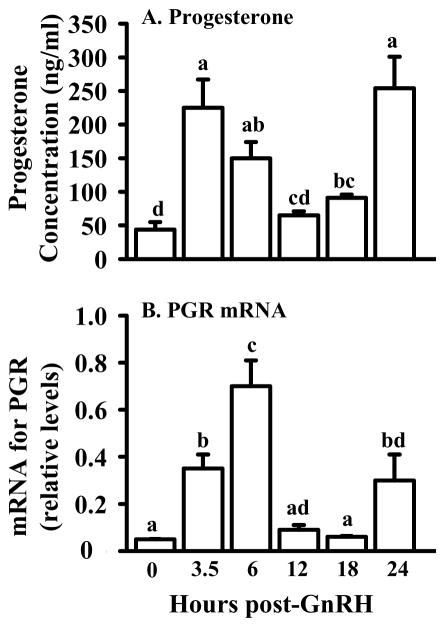
Figure 1.
Concentrations of progesterone (ng/ml ± SEM) in follicular fluid (A) and abundance of mRNA (B) for progesterone receptor (PGR) in follicle wall tissue of bovine pre/periovulatory follicles obtained at 0, 3.5, 6, 12, 18, or 24 h after injection of GnRH to induce an LH/FSH surge. Levels of PGR mRNA were determined by RNase protection assay and relative levels were calculated by correcting for the intensity of the 18S rRNA band in each sample. Values are means ± SEM (n = 3 follicles/time point). Within each panel values with no common superscripts differ (P < 0.05). (Data are derived from Fortune et al., 2001 and Jo et al., 2002).

