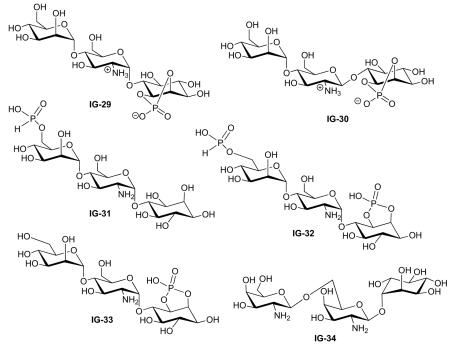
Table 3.
Trisaccharides.

| Study | Compound | Assays* | Activity | Lit. no.‡ | Ref. |
|---|---|---|---|---|---|
| Jaworek (2001) | IG-29 | Lipogenesis | Inactive | 1 | [72] |
| Dietrich (1999) | Conformational study | 4 | [39] | ||
|
| |||||
| Jaworek (2001) | IG-30 | Lipogenesis | Inactive | 2 | [72] |
| Frick (1998) | IG-31 | Lipogenesis | Inactive | 1 | [45] |
| Frick (1999) | 15% MIR EC50 = 25 μM | H | [101] | ||
| Glucose transport | 2% MIR, EC50 = 10 μM | ||||
|
| |||||
| Frick (1998) | IG-32 | Lipogenesis | 20% MIR at 100 μM | 7 | [45] |
| Frick (1999) | 25% MIR, EC50 = 15 μM | G | [101] | ||
| Frick (1998) | Glucose transport | 40% MIR at 20 μM | 7 | [45] | |
| Frick (1999) | 9% MIR, EC50 = 15 μM | G | [101] | ||
| Frick (1998) | GPAT | 25% MIR | 7 | [45] | |
| Glycogenesis | 33% MIR at 20 μM | ||||
| GLUT4 translocation | 50% MIR | ||||
| Lipolysis | 42% MIR | ||||
| Tyrosine phosphorylation of IRS-1 | 30% MIR at 10 μM | ||||
|
| |||||
| Frick (1998) | IG-33 | Lipogenesis | Activity ‘B’* | 8 | [45] |
|
| |||||
| McLean (2008) | IG-34 | PDH phosphatase | Negligible activity for PDP activation | 15 | [32] |
| PDK inhibition | 0.2% inhibition of PDK at 1 mM | ||||
Details of assays (in alphabetical order) are given in the text.
The number assigned to this compound in the cited publication.
Note: For Muller’s SAR study [45] aggregate activities were reported as follows: “A”, MIR < 20%; “B”, MIR 20–49%, EC20 25–200 μM; “C”, MIR 50–80%, EC50 10–100 μM; “D”, MIR > 80%, EC50 3–30 μM.
Lit. no.: Literacy number; MIR: Maximal insulin response; PDH: Pyruvate dehydrogenase; PDK: Phosphoinositide-dependent kinase.
