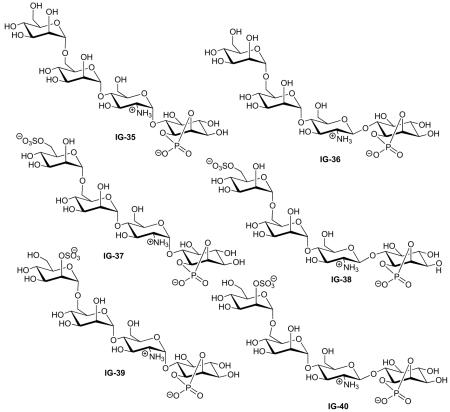
Table 4.
Tetrasaccharides.

| Study | Compound | Assays* | Activity | Lit. no.‡ | Ref. |
|---|---|---|---|---|---|
| Chakraborty (2006) | IG-35 | Lipogenesis | Inactive | 3 | [73] |
| Chakraborty (2006) | IG-36 | Lipogenesis | Inactive | 4 | [73] |
| Chakraborty (2005) | IG-37 | Lipogenesis | 63% MIR, EC50 = 10.6 μM | 3α | [49] |
| Chakraborty (2005) | IG-38 | Lipogenesis | 51% MIR, EC50 = 9.8 μM | 3β | [49] |
| Chakraborty (2005) | IG-39 | Lipogenesis | 78% MIR, EC50 = 1.1 μM | 4α | [49] |
| Chakraborty (2005) | IG-40 | Lipogenesis | 47% MIR, EC50 = 9.5 μM | 4β | [49] |
Details of assays (in alphabetical order) are given in the text.
The number assigned to this compound in the cited publication.
Lit. no.: Literacy number; MIR: Maximal insulin response.
