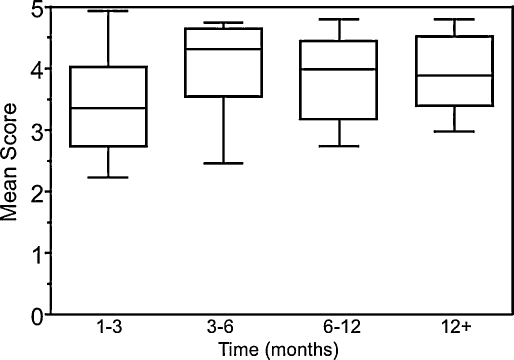
Figure 1.
Mean overall quality of life scores over time (1 to 3, 3 to 6, 6 to 12, and 12 months and beyond) for all patients undergoing endoscopic endonasal approach. Lower and upper limits of the boxes represent the 25th and 75th percentiles, respectively. The horizontal line represents the median and bars, the range.

