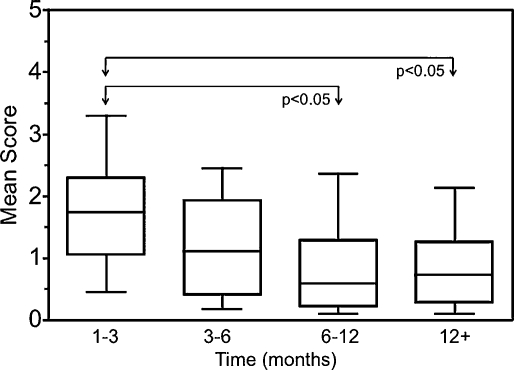
Figure 2.
SNOT-22 scores over time (1 to 3, 3 to 6, 6 to 12, and 12 months and beyond) for all patients undergoing expanded endonasal approach. The lower and upper limits of the boxes represent the 25th and 75th percentiles, respectively. The horizontal line represents the median, and bars, the range. There was a significant difference in the mean SNOT-22 scores between the time periods shown (p = 0.004, Kruskal-Wallis test). The bars and arrows depict significant differences between the time periods 1 to 3 months and 6 to 12 months, and between 1 to 3 months and 12 months and beyond (p < 0.05, post hoc Dunn test).

