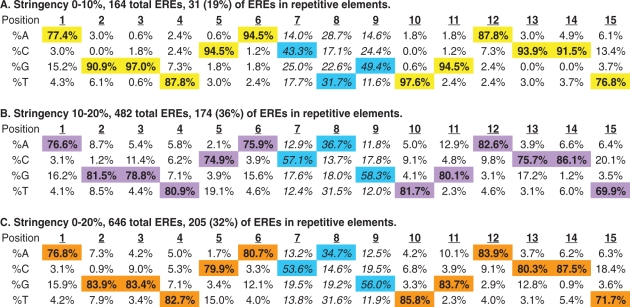
Table 1.
Base frequency matrix as a function of nucleotide position for ERE sequences detected
 |
Transcription Element Search Software (TESS) was used to analyze 1017 ERα-bound loci at two different stringencies of detection. High stringency (0–10% deviation from the consensus ERE sequence) and low stringency (10–20% deviation from the consensus ERE) results are shown in A and B, respectively. These data are pooled (in C) to reveal a total of 646 ERE sequences residing within 509 receptor-bound loci. The distribution of ERE sequences within repetitive elements is indicated for each stringency. The trinucleotide spacer sequences are non-randomly distributed at all stringencies of detection (see main text) even when repetitive element EREs are excluded from the analysis (see Supplementary Table S5). Bold values (also highlighted) are the most common bases found at each position of the detected EREs and the trinucleotide spacer sequences are indicated in italics.
