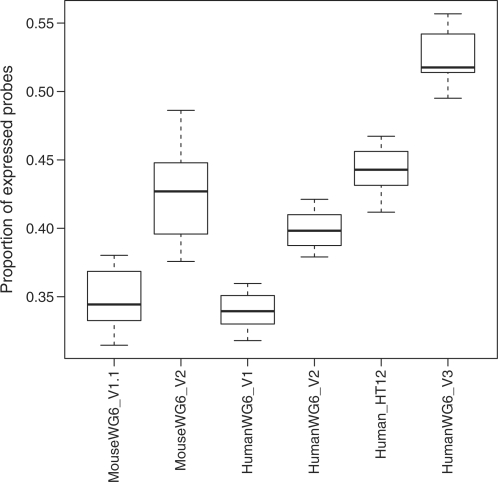
Figure 2.
Proportions of expressed probes estimated for different BeadChip types. All data described in Table 1 are included except for datasets 2 and 6 and the erythrocyte progenitors from data set 4. For each BeadChip type, the boxes show the minimum, first quartile, median, second quartile and maximum of estimated expression proportions across all its arrays.

