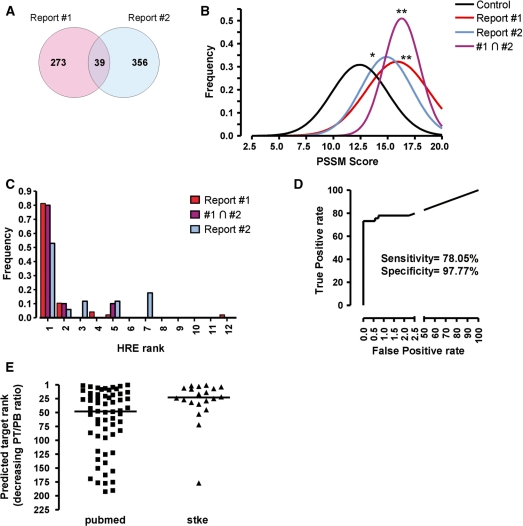
Figure 2.
High HBS scores correlate with functional HIF-binding sites. (A) Venn diagram showing the number of overlapping HIF-binding sites identified by ChIP–chip in two published reports (ref. 29, Report #1; ref. 28, Report #2). (B) The scores of HBSs identified by our strategy were discretized (binning size 0.5 U) and their frequency distribution was calculated and adjusted to a Gauss curve by nonlinear fitting. The graph shows the resulting curves for all the HBSs identified across the genome (control), the HBSs mapping to HIF-binding regions identified by ChIP–chip in each report (Report #1, Report #2) or those HBS in regions common to both reports (#1∩#2). The scores in each group were compared (ANOVA) and statistically significant differences with the control group are indicated by asterisks (*, P < 0.01; **, P < 0.001). (C) The potential HBSs identified for each gene were ranked according to their score in decreasing order (rank 1 corresponds to the highest scoring HBS) and the rank of the predicted HBSs mapping to HIF-binding sites was recorded. The figure shows the rank frequency distribution for predicted HBSs mapping to HIF-binding regions identified by ChIP–Chip in each report (Report #1, Report #2) or regions common to both reports (#1∩#2). (D) Receiver operating characteristic (ROC) curve of known positive/negative (see text) targets versus prediction using a PT/PB ratio of 6.5 as threshold to classify genes as potential targets. (E) Genes identified as potential targets (PT/PB ratio >6.5) were sorted in decreasing PT/PB ratio order. The graph represents the rank of known HIF targets, according to ref. 1 (Stke) or a bibliographic search (PubMed), within the predicted target list. Horizontal line represents the median of each group.

