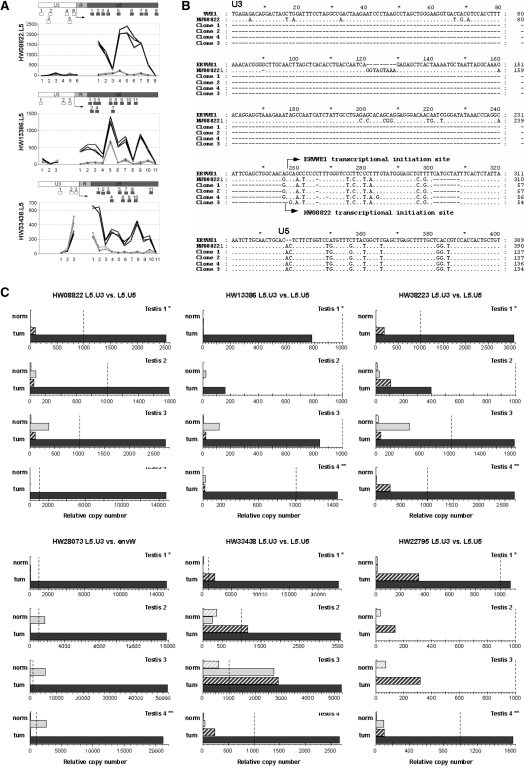
Figure 4.
Identification of autonomous versus non-autonomous LTR activity. (A) Microarray data on U3 versus U5 activity. The dichotomic expressions observed between the U3 and U5 regions of the LTR are represented probe-by-probe for the three identified loci with U3 and U5 parts present on the microarray. Dark gray represents tumoral-testis intensity of the probes, and light gray shows the normal-testis intensity. The positions of all probes along the LTR are schematized below by boxes. The putative initiation site is indicated by an arrow. (B) 5′-RACE identification of autonomous transcriptional induction for the locus HW08822. Sequence alignment of ERVWE1 5′LTR, HW08822 5′LTR and clones obtained by 5′ RACE are represented. The transcriptional initiation site of ERVWE1 is indicated by an arrow as well as the initiation site of HW08822 observed in the three clones. TT1/TN1 match pair was the sample used as in microarray experiment. (C) U3- and U5-specific qRT-PCR s in four testicular normal/tumoral pairs. Expressions of the loci identified as overexpressed in the testicular tumors are represented by dendrograms. Expressions in LTR U3 part are in hatched gray boxes and expressions in LTR U5 part are in filled boxes. Expressions in normal RNA are in light gray and those in tumoral RNA are in dark gray. Expressions are normalized with the expression of G6PD housekeeping gene, which had an averaged copy number of 1000. The values for 1000 copies of G6PD gene are represented by a dotted line. The normal/tumoral sample pair used in the microarray experiment is Testis 1 (*).

