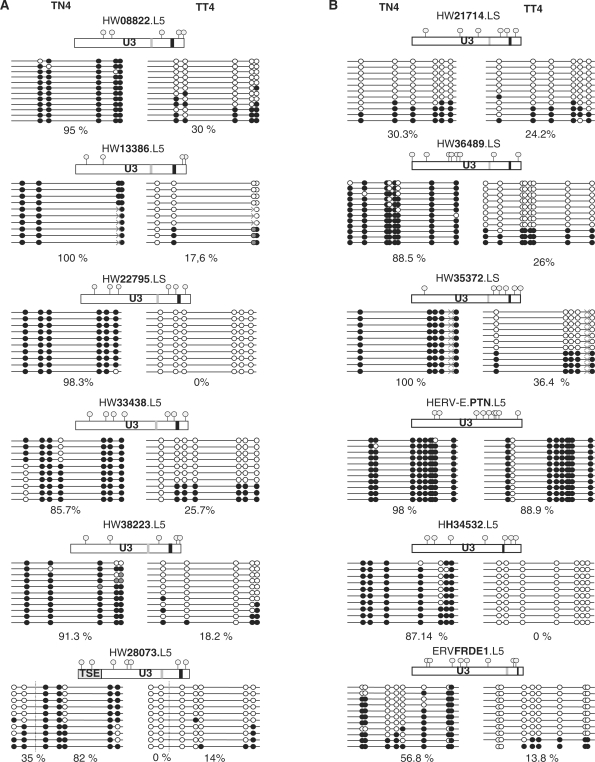
Figure 5.
U3 promoter global methylation comparison in normal versus tumoral testis. (A) Global methylation comparison in the differentially expressed HERV-W LTR. (B) Global methylation comparison in the HERV control LTR. Comparison of CpG methylation status in normal (TN4) and tumoral (TT4) testicular cancer sample of the U3 part of the six differentially expressed HERV-W LTRs (column A) and six HERV LTR controls, namely, three of the HERV-W family and one of each of the HERV-E, HERV-H and HERV-FRD families (column B). All U3 parts are represented and CpG positions are noted by gray circles; CAAT boxes are noted in light gray; and TATAA boxes in darker gray. Highly mutated CAAT and TATAA boxes, in comparison with the reference sequence, are not represented (e.g. in the HERV-E.PTN LTR). Methylated CpG are represented in solid circles and unmethylated CpG are in open circles, undetermined methylation status is in gray circles. Identified SNPs are represented by gray crosses. The percentage of U3 global methylation is indicated for each LTR. For ERVWE1 locus, both the 5′ LTR U3 region and the upstream placental enhancer (TSE) are represented, and the percentage of methylation is indicated for each region.

