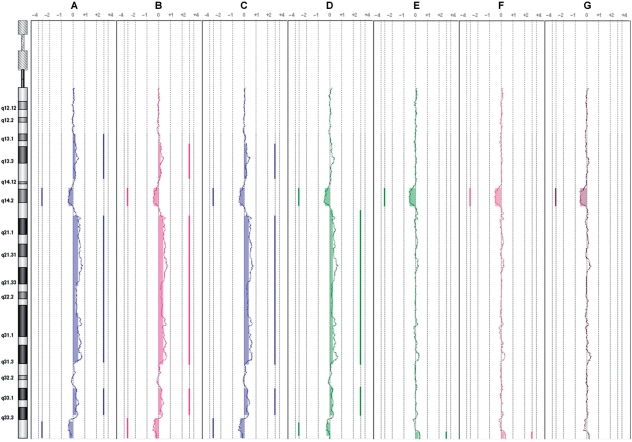
Figure 1.
Application of WACA to a noisy sample (1) WACA application on the CLL11 patient under different corrections (in order in the figure, A = raw data, B = wGCprobe, C = wGCfrag, D = wFragSize, E = wGC150k, F = wGC500k, G = wGC150k+wGC500k+wGCprobe+wGCfrag+wFragSize). Plots of the chromosome 13 are extracted from the DNAanalytics software, and moving averages of the CLL11 sample for each type of corrections are shown. Segments are represented by vertical lines on the right or the left of each profile, respectively, showing gains and losses underlined by filled boxes. As shown, only correction at line G shows a perfect correlation of the plot to the sample’s karyotype at chromosome 13.

