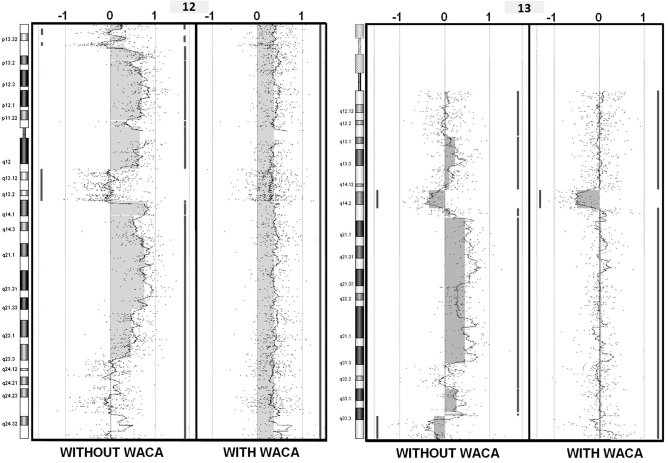
Figure 2.
Application of WACA to a noisy sample (2) Chromosomes 12 and 13 screen captures (DNAanalytics) before and after treatment with WACA for the CLL11 sample selected as an example. Each dot represents the Log2Ratios and a moving average is also drawn. Segments are represented by vertical lines on the right or the left of each profile, respectively showing gains and losses underlined by filled boxes. The sample’s karyotype was [47, XX, +12, del (13)(q14.2)] as shown by the corrected profile.

