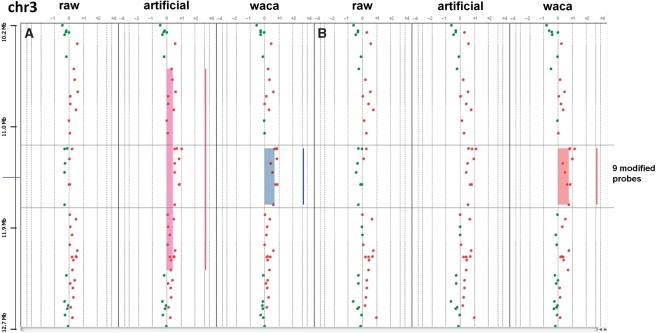
Figure 3.
Chromosome views of artificial profiles. Two samples (A and B) are shown for the following conditions (raw data, modified data and WACA corrected modified data) for chromosome 3. CBS-detected segments are represented by vertical lines on the right of each profile, respectively, showing gains underlined by filled rectangles. The nine modified probes are underlined across the profiles. As shown, while WACA in sample A allows a better delimitation of the artificial aberration, our algorithm allows the recovery of the same aberration in sample B after CBS segmentation.

