
Figure 5.

Family coverage at iteration 5. The frequency of TPs and FPs found at iteration 5, weighted by number of alignments from each search is shown. Both hard (A, B) and randomly sampled (C, D) families were tested against the standard library (all domains, A, C) and the long-domain library (B, D). The weighted FP frequency at iteration 5 is 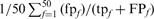 , where
  is the number of FPs of the specified type (HOE-Q, HOE-L, NH, or total errors) in family f at iteration 5,
  is the total number of FPs at iteration 5, and
  is the number of TPs found for the family at iteration 5. Filled squares plot the total weighted coverage of all three error types: HOE-Q (up-triangle), HOE-L (down-triangle) and NH (diamond). Total family coverage (open squares) is defined as
  , where
  is the total number of homologs in the family. With this weighting, a family that finds all of its homologs without any errors will contribute 0.02 to the coverage; a family that finds half of its homologs and an equal number of non-homologs will get a weighted frequency of (0.02 × 0.333) for the HOE-L, HOE-Q or non-hom. error type. For this figure and Figure 7, an HOE-L or HOE-Q alignment is counted both as a TP, reflecting the homologous alignment, and as a FP, because more than half of the alignment is outside the homologous domain; NH alignments are counted as only as FPs.