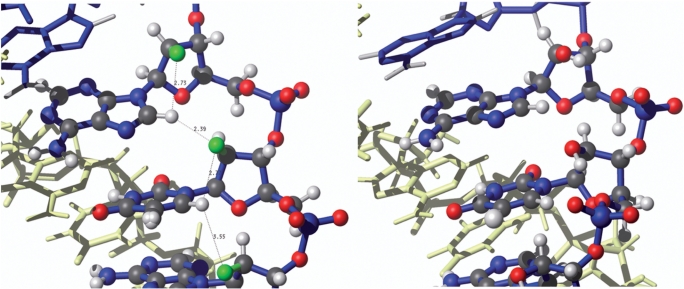
Figure 7.
Details of X2′–H8 interactions in FR and AR. Left, the structure of the FR duplex, showing distances between F2′ and aromatic H6/H8 protons. These distances correlate well with cross-peak intensity of the 19F – 1H HOESY spectra shown in Figure 3. Right, the same region of the AR duplex showing unfavorable steric interactions with 2′-OH.

