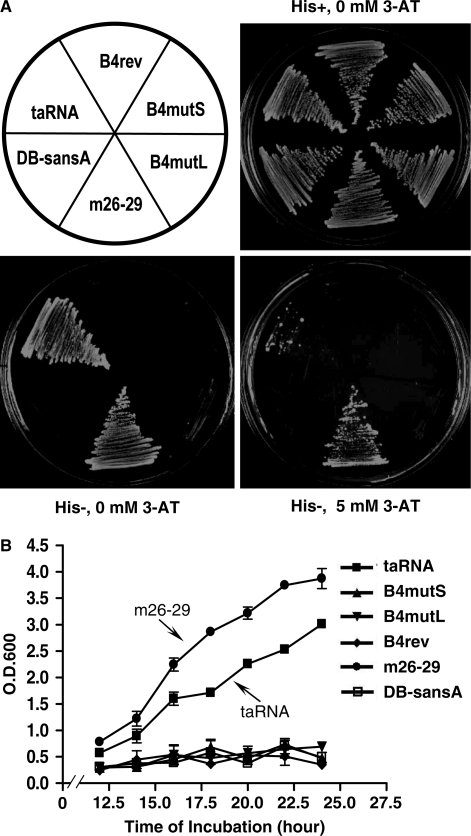
Figure 3.
Activity of the taRNA as measured by the HIS3 reporter gene transcription. (A) Growth on agar plates. Each strain is identified by the molecular construct it harbors and its position on the plates is indicated in the drawing (upper left). The upper right plate is a control plate (ura−, his+) demonstrating that all strains are viable and grow at a normal rate in the absence of selection for HIS3. The two lower plates lack histidine. The lower right plate also contains 5 mM 3-AT. (B) Growth curves measured in liquid media lacking histidine. Values represent the average of three independent cultures of each strain. Error bars show standard deviations.

