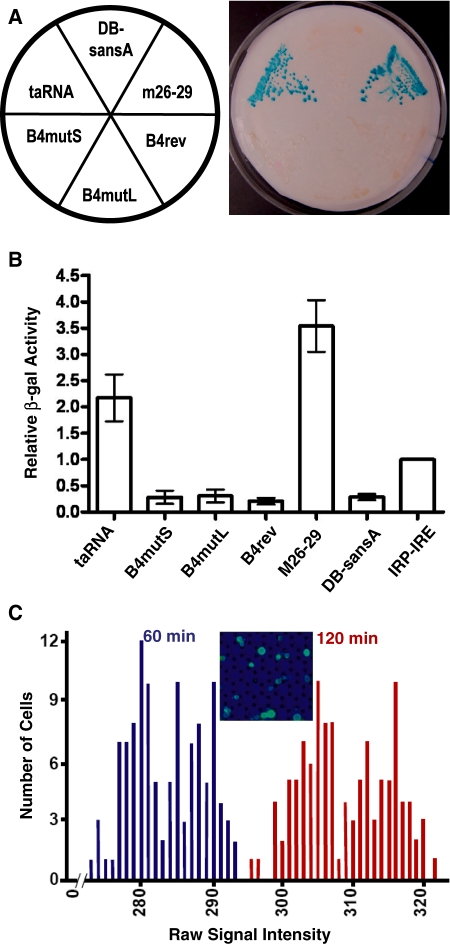
Figure 4.
Activity of the taRNA as measured by β-galactosidase activity. (A) Qualitative filter lift assay of permeabilized cells from a ura-, his- plate using X-gal. (B) Quantitative colorimetric assay of cell lysate using ONPG. The average activity of each strain is shown normalized relative to the Gal4 three-hybrid positive control (IRE-MS2 + AD-IRP) (29). Error bars show standard deviations. (C) Optical array analysis of living single cells using C12FDG. A total of 114 cells were measured one and two hours after adding the substrate. The inset shows a section of the array.

