
Figure 6. Gal-4 and Gal-8 specifically kill blood group B positive E. coli in vivo.
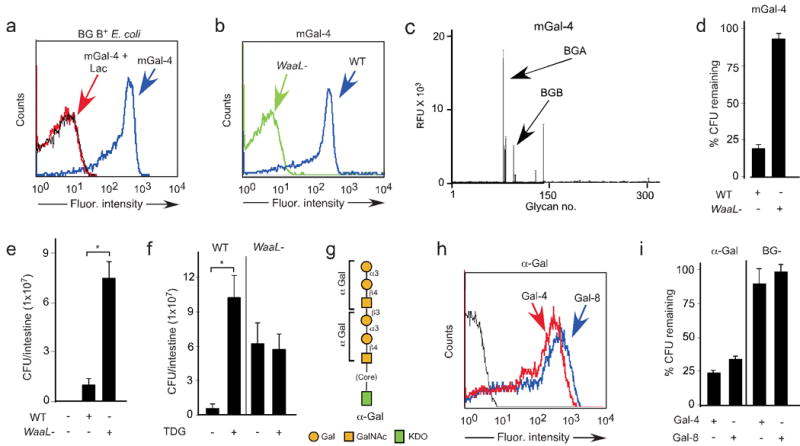
(a) Flow cytometric analysis following incubation of BG B+ E. coli with ∼0.1 μM mGal-4 with or without lactose. (b) Flow cytometric analysis following incubation of BG B+ E. coli and mutants WaaL− with ∼0.1 μM mGal-4. (c) mGal-4 binding to the CFG glycan microarray at 20 μg/ml (0.5 μM). BGB= blood group B glycans, BGA= blood group A glycans (See Supplementary Table 1). (d) Quantification of WT BG B+ and ΔwaaL mutant E. coli after incubation with ~5 μM mGal-4. Viable bacteria were quantified by dilution plating; n = 3 experiments; one representative experiment in duplicate over two dilutions is shown; error bars represent means ± s.d. (e) Live antibiotic-treated mice were fed PBS, Wild type (WT), or WaaL− mutant BG B+ E. coli. The number of viable bacteria in the intestine of mice sacrificed 24 h after feeding was quantified by dilution plating. * = p value 0.049. (f) Growth of WT and WaaL− mutant BG B+ E. coli in the presence and absence of TDG. * = p value 0.008. (g) Schematic of O antigen structures on α-Gal E. coli. (h) Flow cytometric analysis of α-Gal expressing bacteria after incubation of α-Gal–expressing bacteria with ~0.1 μM human Gal-4 or Gal-8. (i) Bar graph showing the percentage of α-Gal–expressing bacteria and BG B− bacteria remaining after incubation with 5 μM Gal-4 and Gal-8 as compared to PBS-treated control bacteria. Viable bacteria were quantified by dilution plating, n=3, representative experiment in duplicate over 2 dilutions shown, error bars=SD.