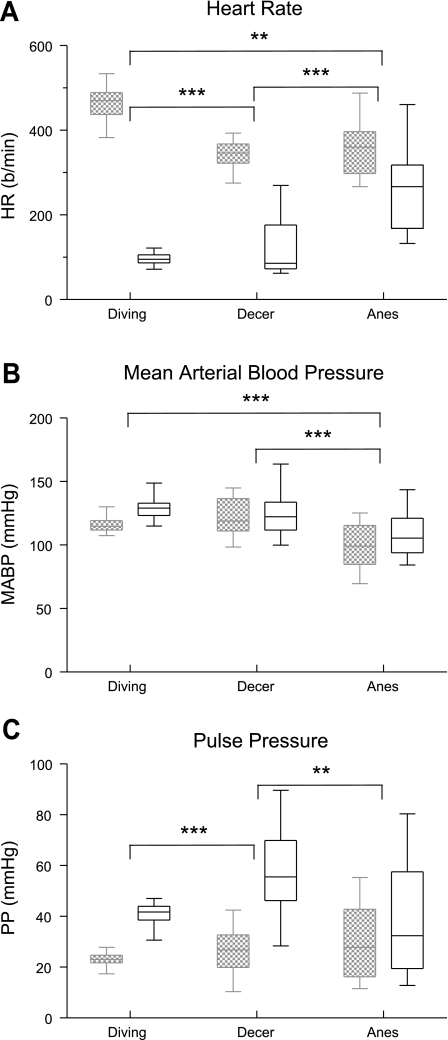
Fig. 5.
Box plots illustrating the changes in HR (A), MABP (B), and PP (C) in rats during voluntary underwater submersion and those with an intercollicular decerebration and stimulated nasally with ammonia vapors or those anesthetized with urethane and stimulated nasally. Hemodynamic parameters taken just before submersion or stimulation are in hatched boxes, while those taken during submersion or stimulation are in open boxes. Note that the responses became more variable when the rats were either anesthetized or decerebrated. **P < 0.01, ***P < 0.001.

